Welp, it’s that time of year again: July is just around the corner, which means it’s peak visitation season in national parks. School is out, families are on vacation, and parks are at their busiest. Below is the July peak, showing visitation across the entire National Park Service by month from 2021 to 2024:

Generally speaking, traffic to NPMaps is also high during these summer months, when my users are pulling up maps before hitting the road. But I’ve noticed that not all my pages follow this pattern, and many actually receive peak traffic in spring or fall. National parks naturally show the same variation. And since I’m a total dork, I wanted to actually get to the bottom of this and find out exactly: which parks clear out most in the summer?
So I turned to the official NPS source for an answer. Unsurprisingly, 85.7% of national park units have higher monthly visitation in June-August than they do during the rest of the year. But that means almost 15% of parks are quieter in the summer. Which ones are they?
To crunch the numbers, I used a 2021-2024 baseline, and considered parks that have visitation stats across this entire window and receive at least 1,000 visitors per month.
Where’d everyone go?
These national parks go quiet in summer
If you want to enjoy a park at its slowest, here’s your list! Below are the top 15 parks, ordered by biggest relative decline in visitation. Percentages show how the average summer month (Jun-Aug) compares to the average non-summer month (Sep-May). So using the chart below, you’d interpret it as: “an average summer month in Joshua Tree gets 52% of the visitation as a non-summer month.”
- Tumacácori National Historical Park (31%)
- Tule Springs Fossil Beds National Monument (35%)
- Tonto National Monument (36%)
- Big Bend National Park (38%)
- Saguaro National Park (39%)
- Chiricahua National Monument (41%)
- Casa Grande Ruins National Monument (45%)
- Organ Pipe National Monument (46%)
- Joshua Tree National Park (52%)
- Guadalupe Mountains National Park (58%)
- Tuzigoot National Monument (62%)
- Big Cypress National Preserve (68%)
- Death Valley National Park (69%)
- Montezuma Castle National Monument (69%)
- Palo Alto Battlefield National Historical Park (75%)
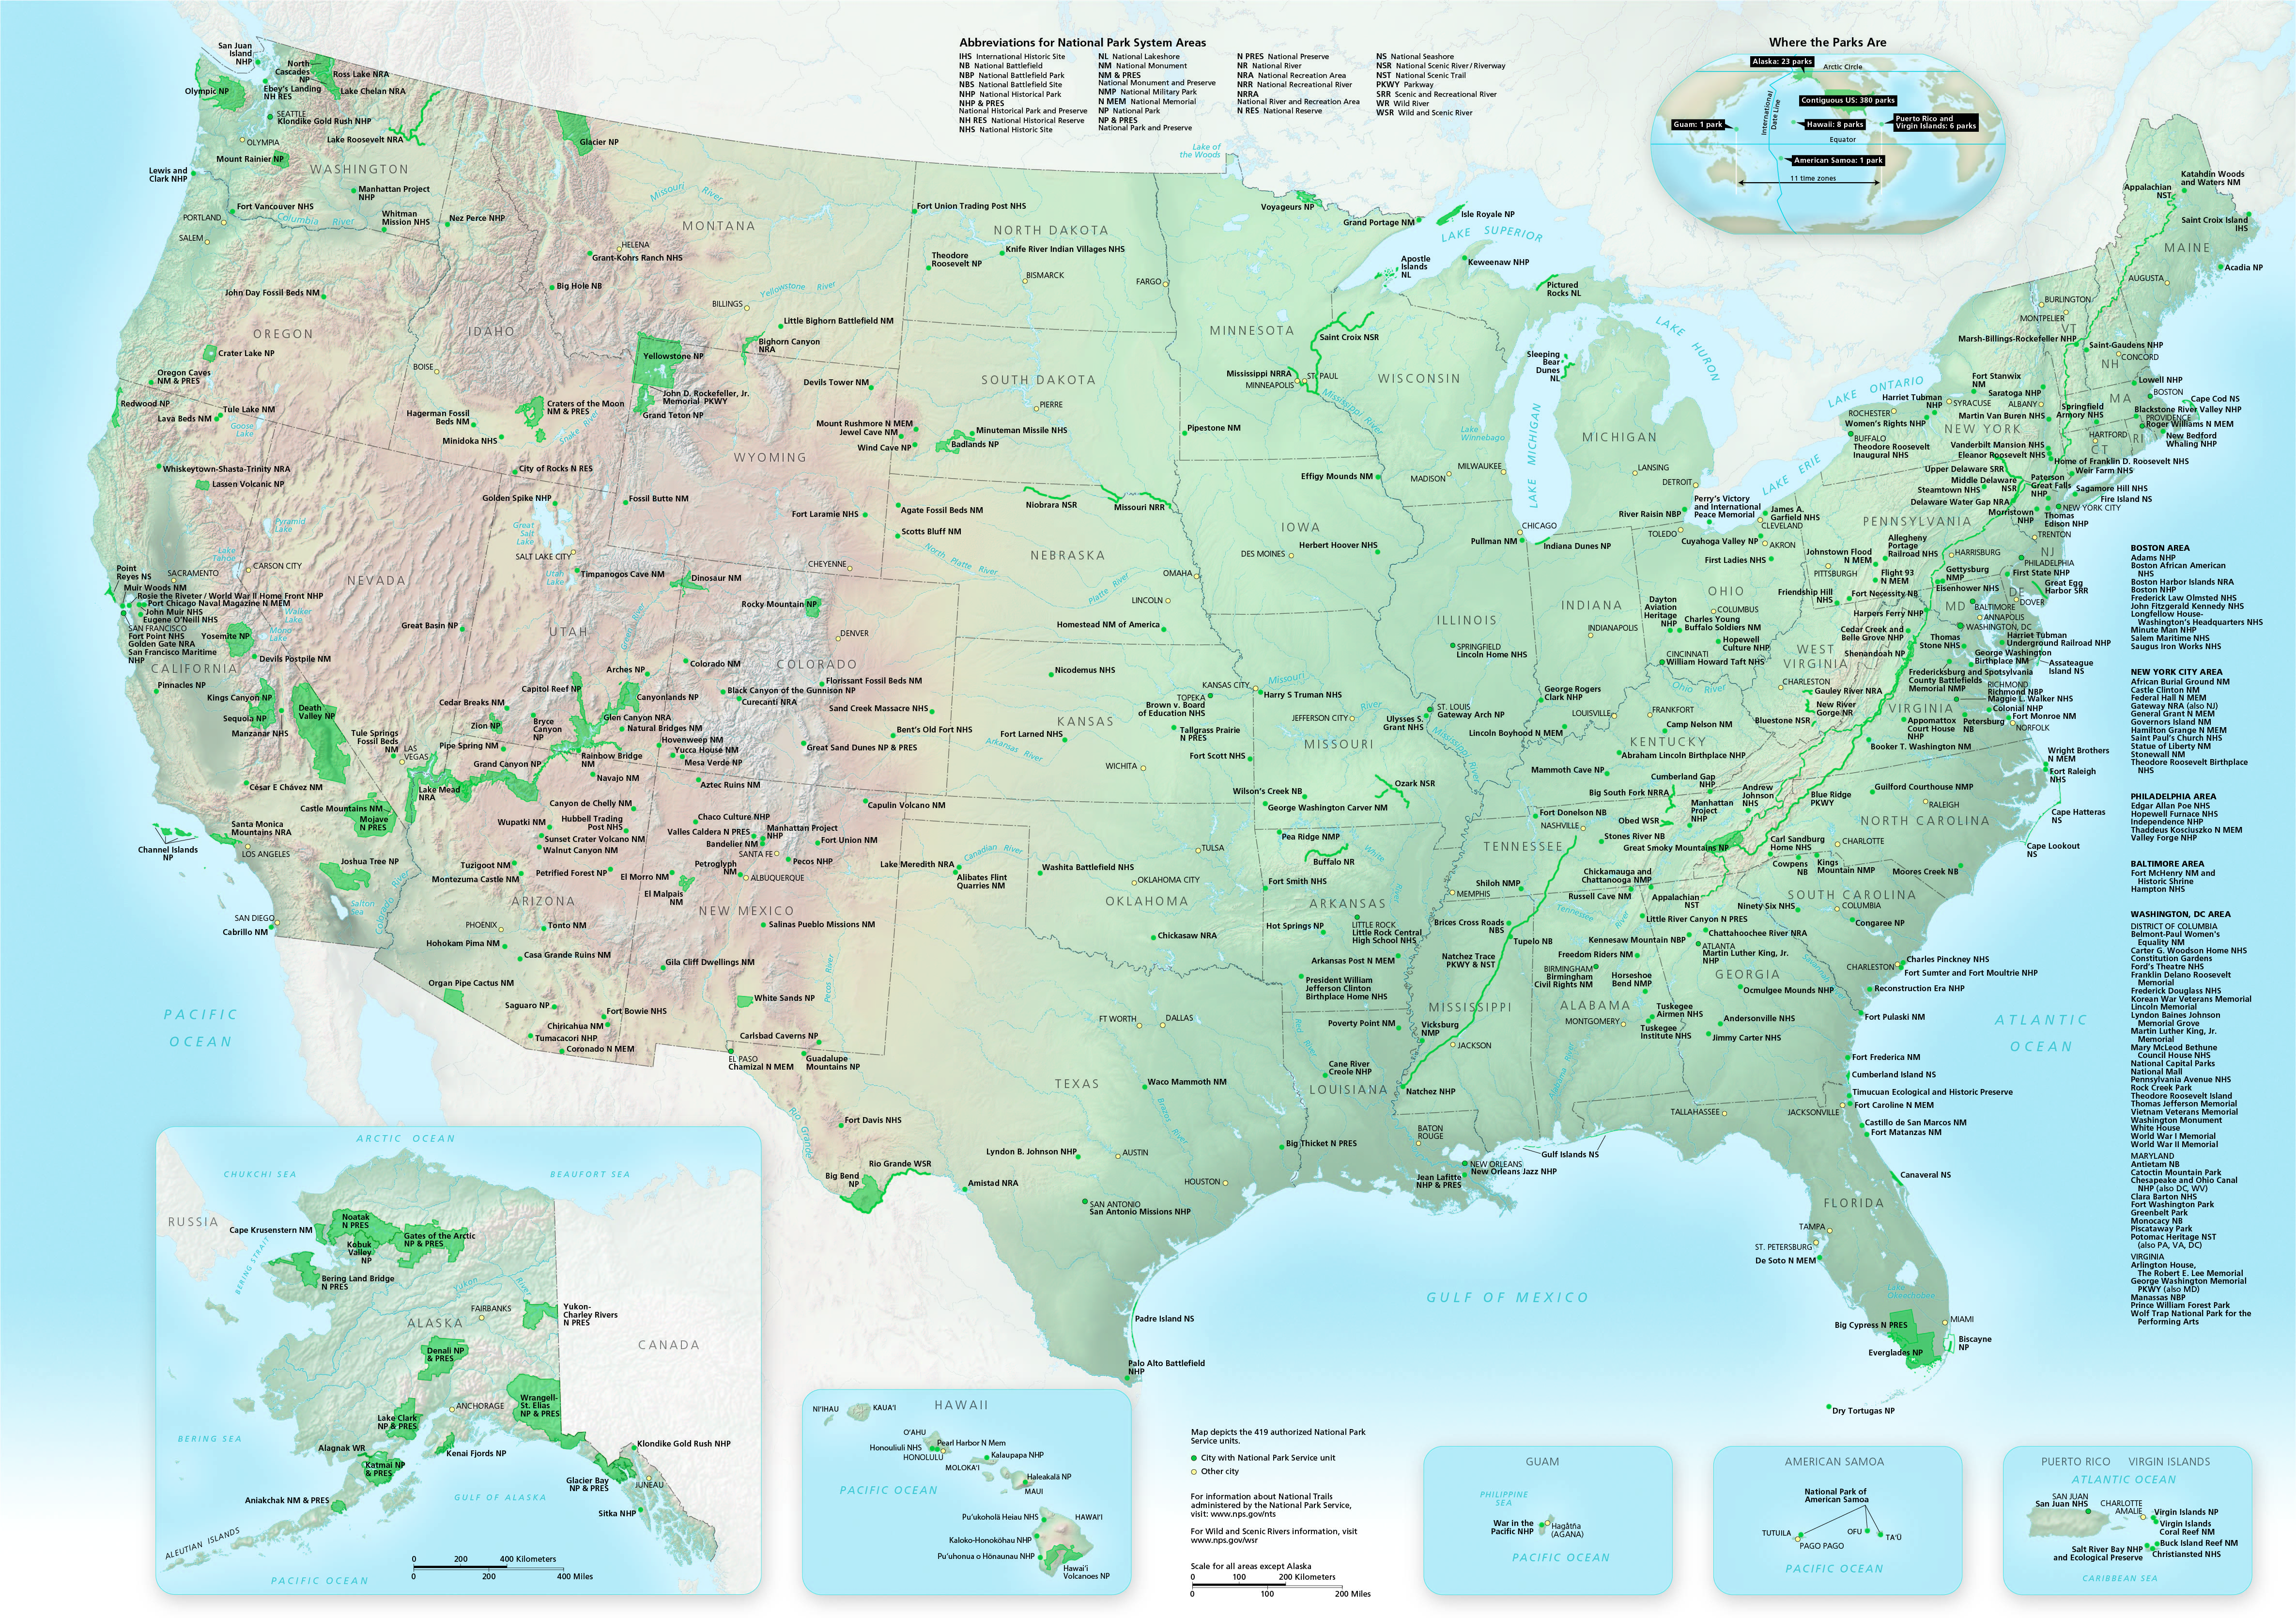
So, what exactly do these parks have in common? Let’s map them. (This is a national park map website after all!)
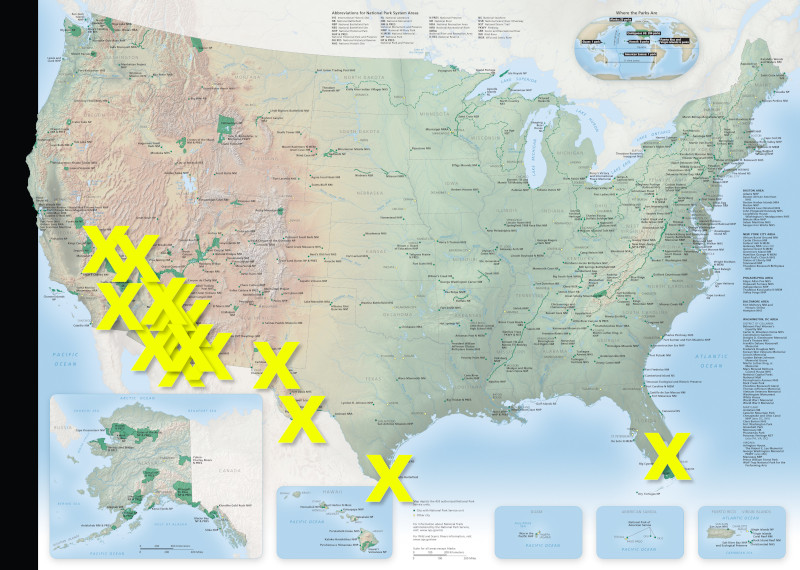
Breaking news! People avoid the desert in the summer! OK, so this isn’t the most insightful thing I’ve ever done; we naturally see a heavy concentration in the desert landscapes of the Southwest. Smaller, quick-visit Arizona parks dominate the list, though we see a few larger iconic parks like Big Bend, Joshua Tree, and Death Valley. The most northern park on our list is, in fact, Death Valley…and that happens to be the hottest park of them all. So, nothing too groundbreaking here, but it’s nice to see our assumptions confirmed. And that did leave me curious about the inverse.
The gang’s all here
These national parks boom in summer
Of the 85.7% of parks that are busier in summer, I wanted to know which ones took it to the max: where do we see the most extreme summer surge in visitation? I’m not interested in raw visitor numbers (because the busiest parks would dominate) but relative visitation. And here they are! Percentages below show how the average summer month (Jun-Aug) compares to the average non-summer month (Sep-May).
- Lake Clark National Park and Preserve (1,764%)
- Wrangell-St Elias National Park and Preserve (1,398%)
- Isle Royale National Park (1,371%)
- Katmai National Park and Preserve (1,307%)
- Kenai Fjords National Park (1,293%)
- Denali National Park and Preserve (1,035%)
- Devils Postpile National Monument (910%)
- Niobrara National Scenic River (903%)
- Boston African National Historic Site (709%)
- Sleeping Bear Dunes National Lakeshore (695%)
- Lowell National Historical Park (683%)
- Wolf Trap National Park for the Performing Arts (672%)
- Lincoln Boyhood National Memorial (664%)
- Jewel Cave National Monument (650%)
- Keweenaw National Historical Park (623%)
Let’s map these too:

Now we’re getting somewhere! There’s a bit more to unpack here. Unsurprisingly, the top slots are dominated by Alaska, where some parks can be nearly impossible to visit (Alaska Air won’t exactly be dropping you off in Katmai). Similar considerations apply to Isle Royale (icebound in the middle of Lake Superior) and Devils Postpile (snowbound in the Sierra Nevada). (Also, how wild that California has a park on this list too, just a few hours from Death Valley? It really speaks to the state’s geographic diversity.) We also see a couple more Michigan parks and some sparsely populated regions of South Dakota and Nebraska. And then some surprises. Lowell National Historical Park appears here thanks to Lowell’s annual folk festival, which increases park visitation ten-fold in July. Wolf Trap appears because it’s a performing arts venue and most events happen during the summer. But the biggest surprises to me are Boston African (in Boston) and Lincoln Boyhood (in southern Indiana). Similar parks in their regions don’t show such extreme summer spikes, so I confess that I’m unsure whether there’s something exceptionally unique about these parks or if it’s an artifact of how their staff counts visitors.
It really doesn’t matter when
These national parks are most steady
And because I’m me, I couldn’t resist going a little further: which parks have the steadiest monthly visitation? Where can you visit anytime and experience the same level of crowding all year? For this, I simply looked at the lowest standard deviation of visitation across all months.
- Natchez Trace Parkway
- Puʻuhonua o Hōnaunau National Historical Park
- War In The Pacific National Historical Park
- Haleakalā National Park
- Kaloko-Honokōhau National Historical Park
- Santa Monica Mountains National Recreation Area
- Big Thicket National Preserve
- Cabrillo National Monument
- Richmond National Battlefield Park
- Coronado National Memorial
- Hawaiʻi Volcanoes National Park
- Christiansted National Historic Site
- Moores Creek National Battlefield
- Cowpens National Battlefield
- Chickamauga & Chattanooga National Military Park
Let’s go to the map!

We can tease out some obvious commonalities here. Six parks are located on tropical islands without major seasonal weather variation: Hawaiʻi, Guam, and U.S. Virgin Islands. Four parks are battlefield sites from Virginia to Georgia, where winters are relatively mild (and visitors to these sites don’t exactly require perfect hiking weather anyway). Once again, some California parks show up here, and they’re located near Los Angeles and San Diego for a steady supply of local and tourist traffic. (San Francisco’s Golden Gate National Recreation Area similarly just missed making the cut.) Topping the chart is the Natchez Trace Parkway, which sees only a minor dip in winter traffic. And of course we have……wait, Southern Arizona?! The region that dominated our first list?! Coronado National Memorial is actually tucked up near a mountain pass, which gives the park a milder climate than the surrounding desert and a reason for visitors to stop by at any time of year.
Well, this was fun. Did I have a major point and grand conclusion to this effort? Not really. But we’ve learned some things! Now this summer you can:
- Use the first list to visit a park when absolutely no one else is crazy enough to do so. Because you’re strong and badass and tough. You won’t let a little heat stop you! (But please stay safe.)
- Use the second list to visit a park when everyone else does. Because you’re an extrovert to the max, and nothing quite tickles your fancy like accepting the wisdom of the masses. People give you energy, and what’s better than seeing everyone else enjoy the same thing as you?
- Use the third list to conduct your own experiment. Visit now and during a different season to see firsthand if the data is lying to you. Or at the very least, take comfort in knowing that you can see any of those parks whenever is convenient rather than waiting for the perfect time of year.
OK, OK, so maybe this isn’t the most actionable post full of relevant trip-planning advice, but sometimes I’m just curious to learn something. And this time I figured I’d share what I found even though it doesn’t tie directly to NPMaps content. But isn’t that what a bully pulpit is for? Smashing people in the face with knowledge and statistics? (Or maybe I’m doing it wrong.) If nothing else, I hope this helps you appreciate the incredible diversity of units in the U.S. national park system. It’s this very diversity that has made the National Park Service such a vital steward of our nation’s natural wonders, cultural history, and national identity for over 100 years.